
728x90
반응형
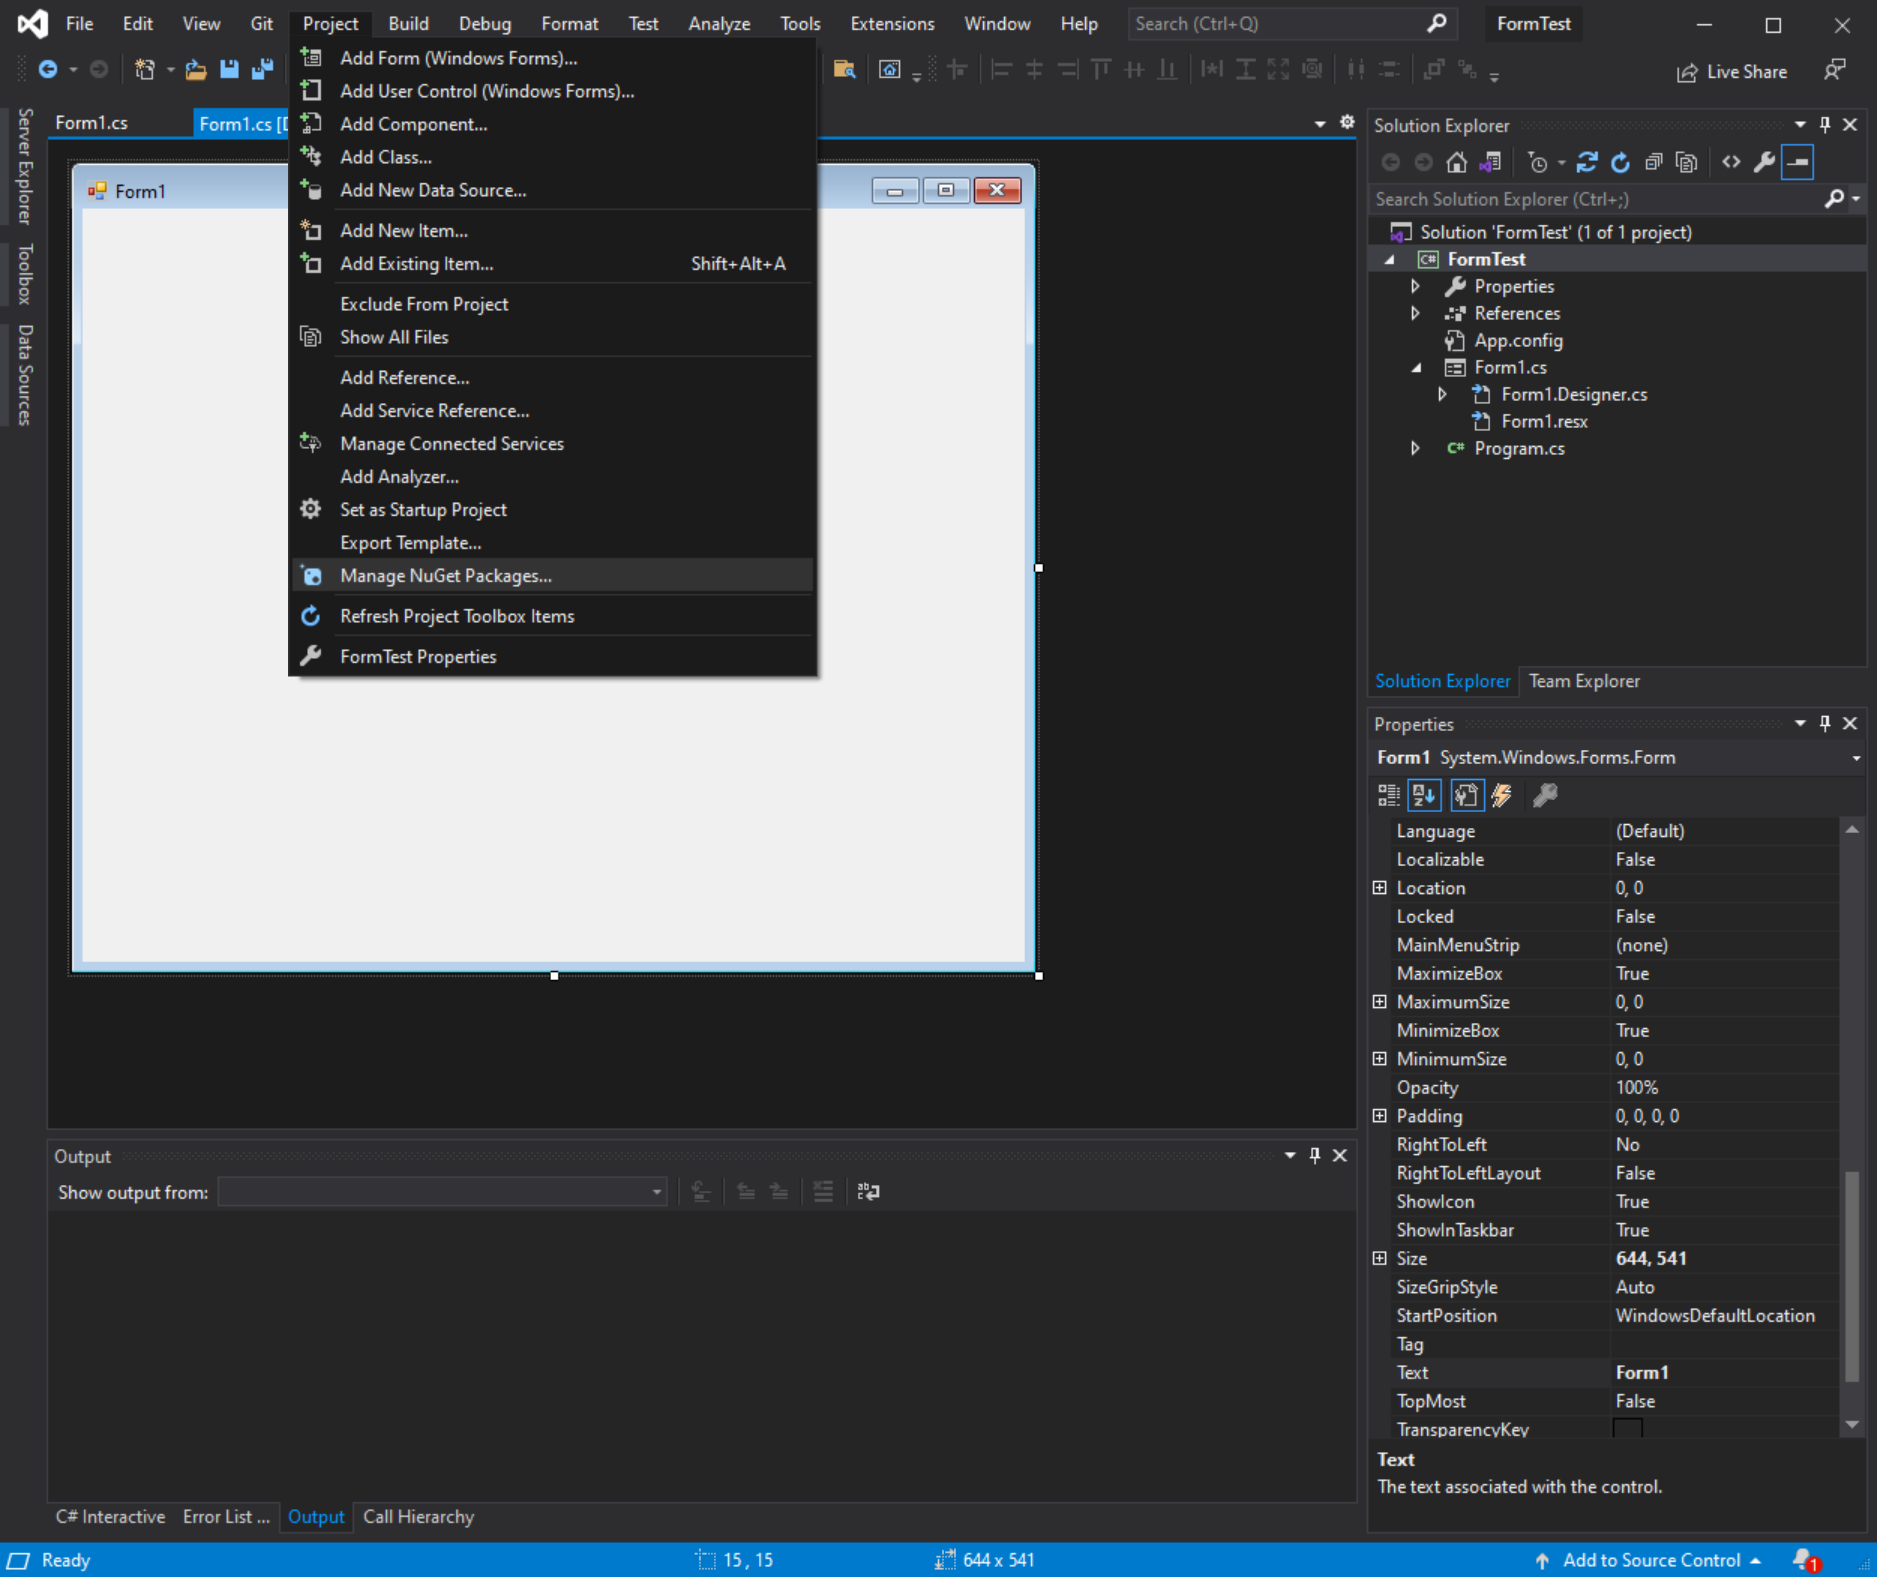
Project > Manage NuGet Packages... 클릭

Browse > zedgraph 검색 후 하단 ZedGraph Install 버튼 클릭하여 설치


설치가 완료되면 도구상자 Toolbox에 ZedGraph Library가 추가되고, 하단에 ZedGraphControl을 이용하여 그래프를 그릴 수 있다.

메인 Form에 zedGraphControl1 및 button1 추가


- using ZedGraph; 추가
- 전역변수로 GraphPane, PointPairList 추가
- InitGraph()로 그래프 타이틀 및 축 등 그래프 기본 설정하기
- button1_Click 했을 때 그래프 실시간으로 그리도록 코드 추가
[전체 소스코드]
|
1
2
3
4
5
6
7
8
9
10
11
12
13
14
15
16
17
18
19
20
21
22
23
24
25
26
27
28
29
30
31
32
33
34
35
36
37
38
39
40
41
42
43
44
45
46
47
48
49
50
51
52
53
54
55
56
57
58
59
60
61
62
63
64
65
66
67
68
69
70
71
72
|
using System;
using System.Drawing;
using System.Windows.Forms;
using ZedGraph;
namespace FormTest
{
public partial class Form1 : Form
{
GraphPane _myPane;
PointPairList _points;
public Form1()
{
InitializeComponent();
InitGraph();
}
public void InitGraph()
{
_myPane = zedGraphControl1.GraphPane;
//타이틀 설정
_myPane.Title.FontSpec.Size = 15;
_myPane.Title.Text = "Graph";
_myPane.Title.FontSpec.IsBold = true;
//X축 설정
_myPane.XAxis.Title.FontSpec.Size = 12;
_myPane.XAxis.Title.Text = "X Axis";
//실시간으로 Scale 변경 자동으로 하도록
_myPane.XAxis.Scale.MinAuto = true;
_myPane.XAxis.Scale.MaxAuto = true;
_myPane.XAxis.Scale.MajorStepAuto = true;
_myPane.XAxis.MajorGrid.IsVisible = true;
_myPane.XAxis.MinorGrid.IsVisible = false;
_myPane.XAxis.MajorTic.Color = Color.Black;
//Y축 설정
_myPane.YAxis.Title.FontSpec.Size = 12;
_myPane.YAxis.Title.Text = "Y Axis";
//실시간으로 Scale 변경 자동으로 하도록
_myPane.YAxis.Scale.MinAuto = true;
_myPane.YAxis.Scale.MaxAuto = true;
_myPane.YAxis.Scale.MajorStepAuto = true;
_myPane.YAxis.MajorGrid.IsVisible = true;
_myPane.YAxis.MinorGrid.IsVisible = false;
_myPane.YAxis.MajorTic.Color = Color.Black;
//그래프 Chart 색, Border 색/굵기 설정
_myPane.Fill = new Fill(Color.FromArgb(255, 238, 238, 238));
_myPane.Chart.Fill = new Fill(Color.LightGray, Color.LightGray, 180.0f);
_myPane.Chart.Border.Color = Color.Black;
_myPane.Chart.Border.Width = 2;
//Point 리스트를 그래프 Curve 리스트에 추가
_points = new PointPairList();
_myPane.CurveList.Clear();
LineItem curve = _myPane.AddCurve("Sqrt(X)", _points, Color.Green, SymbolType.None); //라인 범례 이름 Sqrt(X)
//LineItem curve = _myPane.AddCurve("", _points, Color.Green, SymbolType.None); //라인 범례 없음
curve.Line.Width = 2;
_points.Clear();
zedGraphControl1.AxisChange();
zedGraphControl1.Invalidate();
zedGraphControl1.Refresh();
}
private void button1_Click(object sender, System.EventArgs e)
{
for (int i = 0; i < 100; i++)
{
//그래프 포인트 추가
_points.Add(i, Math.Sqrt(i));
//실시간으로 그래프 반영하여 보여주기
zedGraphControl1.AxisChange();
zedGraphControl1.Invalidate();
zedGraphControl1.Refresh();
}
}
}
}
|
cs |
728x90
반응형
'IT > C#' 카테고리의 다른 글
| [C#] String 문자열끼리 비교하기. String 문자열 오름차순/내림차순 정렬. List<Struct> 구조체 리스트 오름차순/내림차순 정렬. (10) | 2024.01.26 |
|---|---|
| [C#] ComboBox AutoComplete 기능 총정리. 콤보박스 아이템 추가하기+삭제하기+검색하기(자동완성 필터 기능 추가하기). (6) | 2024.01.11 |
| [C#] MessageBox 버튼 종류 및 아이콘 설정하기. (2) | 2023.11.30 |
| [C#] Button Click Event 여러개 동적 할당하기. (0) | 2023.11.30 |
| [C#] Form Close Button Disable. 폼 컨트롤 박스 닫기 버튼 사용 못하도록 처리하기. (2) | 2023.11.22 |